Hold down the T key for 3 seconds to activate the audio accessibility mode, at which point you can click the K key to pause and resume audio. Useful for the Check Your Understanding and See Answers.
Lesson 2: Properties of Liquids
Part b: Vapor Pressure
Part a:
Boiling and Melting
Part b: Vapor Pressure
Part c:
Surface Tension
Part d:
Capillary Action
Part e:
Viscosity
 Vapor and Liquid Interactions
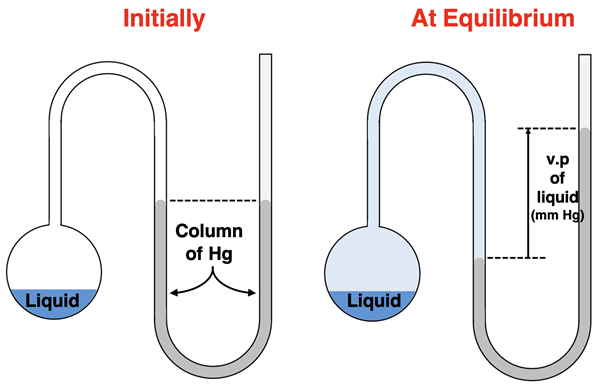
Suppose that we half-fill a container with a liquid and seal the container with a column of mercury. Initially, only air is present at atmospheric pressure above the liquid. Molecules of liquid are in constant random motion about the bulk of the liquid. Those molecules are moving with a wide collection of speeds - some fast, some slow, and most with intermediate speeds.
Earlier in Chapter 10, we discussed the range of speeds for particles in a sample of gas. We introduced the idea of a Boltzmann distribution of speeds. A very similar distribution of speeds is observed for liquids. Admittedly, the distribution is not exactly the same for liquids as for gases due to the existence of intermolecular forces in the liquid phase. But there is still a distribution of speeds (and kinetic energies) and we can represent this distribution by a plot as shown below.
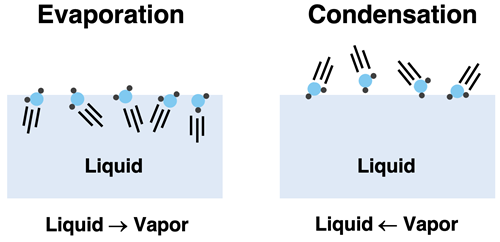
 As we discussed on the previous page of Lesson 2, intermolecular forces hold particles in the liquid state. But even at low temperatures, there is always a small percentage of particles that are moving with a sufficient amount of kinetic energy to hit the surface of the liquid and escape the forces that hold them in the liquid state. These particles will evaporate and become part of the gaseous or vapor state. This is characteristic of any liquid; there is always a vapor present above the liquid.
There will be two competing processes occurring at the surface of the liquid. One process is evaporation - liquid particles turn to vapor. The other process is condensation; there will be particles of vapor that strike the liquid and be drawn by intermolecular forces to join the liquid state again. The two processes are the opposite of each other. Evaporation causes the number of particles in the vapor state to increase. Condensation causes the number of particles in the vapor state to decrease.
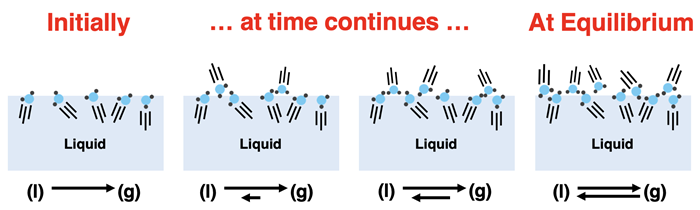
When we first fill our container with liquid, there is no vapor above the liquid. The rate at which vapor condenses depends on how much vapor is present. As such, there is initially no condensation since vapor particles are not present. But evaporation begins to occur immediately and persists at a constant rate. Particles of vapor begin to populate the space above the liquid. This causes the rate of condensation to increase. Evaporation continues. As it does, more and more particles of vapor are present. This causes the rate of condensation to continuously increase. Eventually the rate of the two competing process is equal. Liquid turns to vapor at the same rate that vapor turns to liquid. The amount of vapor and liquid remain constant. We refer to this state as the equilibrium state. It is a dynamic state in which the two competing processes balance each other out such that a change in the amount of vapor is not observed.
Vapor Pressure
A liquid and its vapor will always establish this equilibrium state. One established, the amount of vapor present above the liquid will remain steady or constant. Like any gas, these particles of vapor exert a pressure. The pressure that the vapor exerts at equilibrium is called the vapor pressure. All liquids have a unique vapor pressure that is dependent upon the temperature.
In our situation, the initial liquid was present in a container that was sealed by a column of mercury present in a U-tube. The only gas initially above the liquid was air. The evaporation of the liquid results in a mixture of air and the vapor of the liquid. Consistent with Dalton’s law of partial pressures, the total pressure of this mixture increases due to the addition of vapor to the air. We would observe the column of mercury shift. The mercury level would rise up the opposite side of the U-tube. The height to which it rises equals the pressure of the vapor. This provides a convenient means of determining the vapor pressure.
Vapor Pressure and Temperature
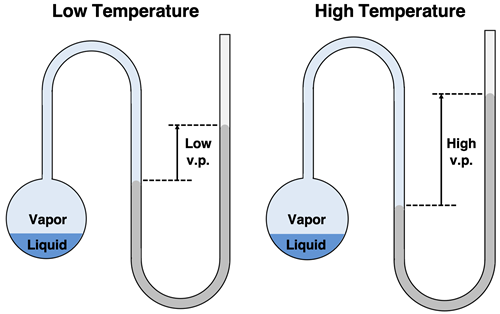
 The vapor pressure of all liquids is dependent upon the temperature of the liquid. This makes sense if you re-consider our discussion of the distribution of particles speeds (and kinetic energies) within a liquid. The average kinetic energy of the particles is proportional to the Kelvin temperature. So, at higher temperatures, particles are moving faster. The entire distribution of kinetic energies is shifted. This means that the fraction of particles that possess the minimum amount of kinetic energy to escape the liquid state increases. More particles of liquid vaporize at a higher temperature. This leads to an increase in the vapor pressure. At higher temperatures with more particles in the vapor state, the column of mercury in the U-tube would be pushed up the right side of the tube to a higher height.
The data and graph below show the dependence of vapor pressure upon temperature for water. The graph shows an exponential rise in vapor pressure with increasing temperature. This same exponential curve is observed for nearly all liquids.
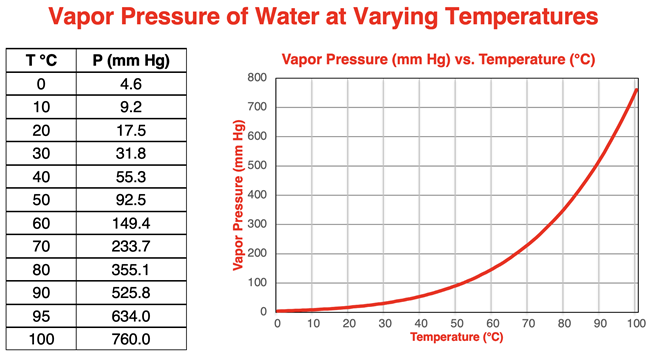
A close look at the data reveals what may at first seem to be a strange factoid. The vapor pressure of water at 100°C is 760 mm Hg. Put another way, the vapor pressure of water at its normal boiling point temperature is 1 atm. What’s up with that? You’re about to find out.
Boiling Point Revisited
 The temperature at which a liquid boils is dependent upon the surrounding pressure. On the previous page of Lesson 2, we defined the normal boiling point as the temperature at which a liquid turns to a gas when the pressure is 1 atm. For water, the normal boiling point is 100°C. And now we see why. The vapor pressure-temperature data (above) shows that the vapor pressure of water is 760 mm Hg (1 atm) at a temperature of 100°C. This discussion leads to a more generic definition of boiling point:
The boiling point of a substance is the temperature at which the vapor pressure of the substance is equal to the surrounding pressure.
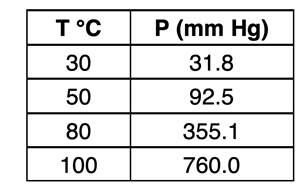
This should strike you as amazing because the statement implies that water can boil at any temperature. The boiling point is pressure dependent. If the surrounding pressure is changed, the boiling point will change. Consider the vapor pressure data at the right. If the surrounding pressure is reduced to 355.1 mm Hg, then water will boil at 80°C. If the surrounding pressure is reduced to 92.5 mm Hg, then water will boil at 50°C. And if the surrounding pressure is reduced to 31.8 mm Hg, water will boil at 30°C.
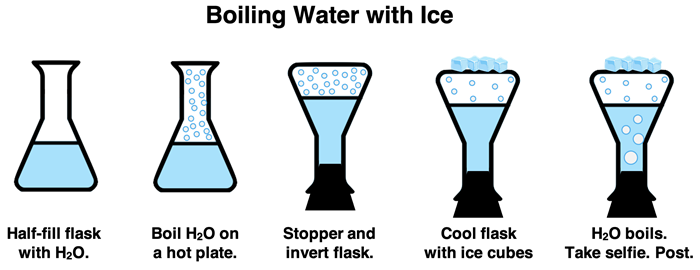
A common Chemistry demonstration involves the boiling of water with ice. The process begins by boiling water in a flask on a hot plate. Once boiling is established, the flask is removed from the heat and securely stoppered. The flask is turned upside down and supported in a ring stand; this exposes the flat side of the flask. Ice is then placed on the flat side of the flask. This lowers the temperature of the vapor (mostly water vapor) above the flask and causes some condensing. The pressure surrounding the water is lowered, thus lowering the boiling temperature. The water begins boiling at a temperature well below its normal boiling point … thanks to the ice.
(Watch the demonstration.)
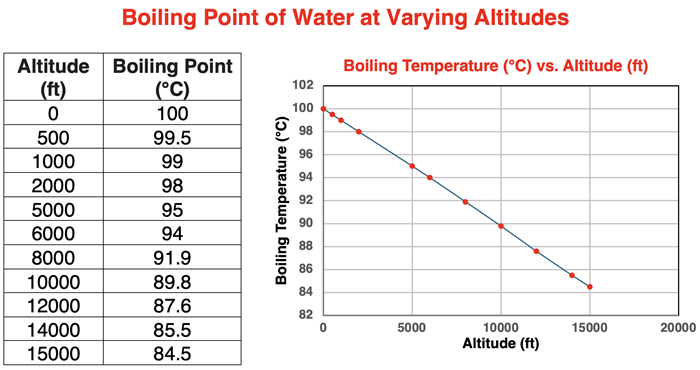
Those who live at higher altitudes are very aware that water boils at temperatures other than 100°C. Air is thinner at higher altitudes and atmospheric pressure is lower. Since the boiling point of water is dependent upon the surrounding pressure, altitudes will indirectly affect boiling points. The dependence of boiling point upon the altitude (relative to sea level) is demonstrated in the data table and graph below.
Vapor Pressure, Boiling, and Intermolecular Forces
A common theme throughout Chapter 11 of our Chemistry Tutorial has been that the boiling point of a liquid is correlated to the strength of the intermolecular forces that hold the liquid together. We can add to the theme by stating that the vapor pressure of a liquid is also correlated to the strength of the intermolecular forces. At room temperature, many liquids have a very high vapor pressure. We typically refer to them as volatile liquids. Because of their weak intermolecular forces, liquid particles more easily escape from the liquid state. Such liquids tend to evaporate quickly.
The vapor pressure-temperature curves for five different liquids are shown below. Each curve is labeled A through E. The identity of the five liquids is indicated. The normal boiling points are also shown on the graphs.
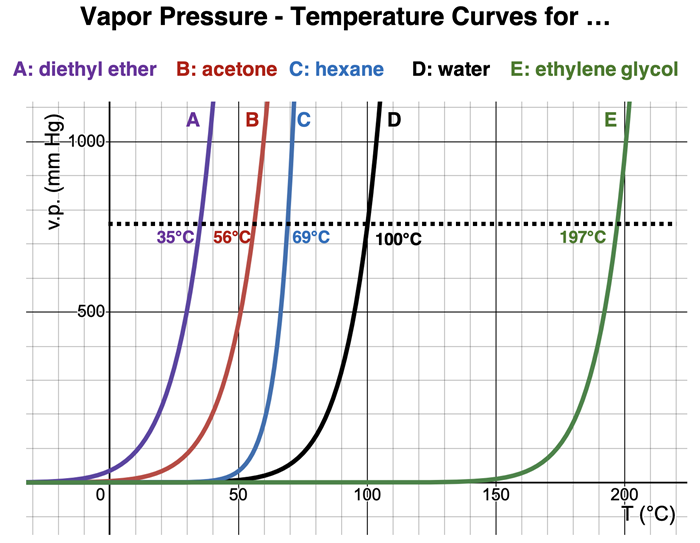
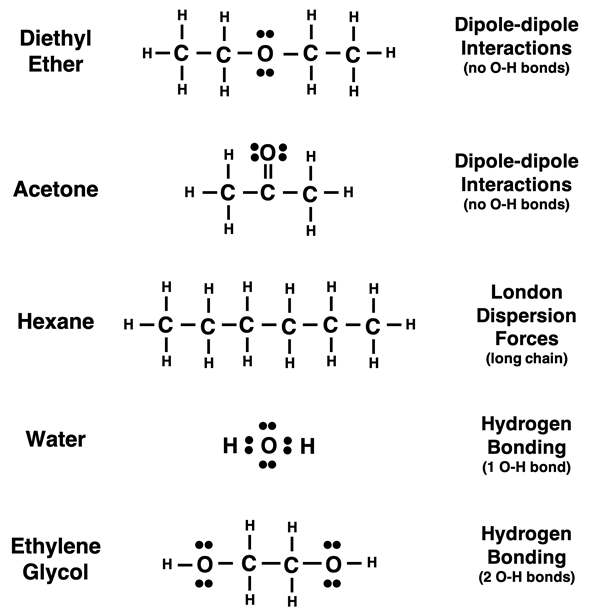
We are most familiar with water and less familiar with the other four liquids. The Lewis electron dot diagrams for each are shown below. An inspection of their dot diagrams helps to explain the ordering of the curves. Water (D) and ethylene glycol (E) are the least volatile of the five liquids; they have the higher boiling points. They both experience hydrogen bonding forces due to the O-H bonds. This leads to strong intermolecular forces and explains their higher boiling points. Ethylene glycol (E) has the highest boiling point of the five liquids; its high boiling point is explained by the presence of two O-H bonds within the molecule.
Diethyl ether (A) and acetone (B) are both polar. They experience dipole-dipole interactions. This type of intermolecular force is typically stronger thanLondon dispersion forces but considerably weaker than the hydrogen bonding experienced by water (D) and ethylene glycol (E). Hexane (C) is nonpolar. It only experiences London dispersion forces. However, it is a long chain hydrocarbon (6 carbon atoms chained together). Long chains result in the strengthening of London dispersion forces. This explains the slightly higher boiling point of hexane compared to the two polar liquids.
Before You Leave
- Download our Study Card on Vapor Pressure. Save it to a safe location and use it as a review tool. (Coming Soon.)
- The Check Your Understanding section below include questions with answers and explanations. It provides a great chance to self-assess your understanding.
Check Your Understanding
Use the following questions to assess your understanding. Tap the Check Answer buttons when ready.
1. Consider the example of the liquid in the container attached to the U-tube filled with mercury (discussed at the beginning of the page). As the liquid evaporates, the mercury rises up the right side of the U-tube. Why does it rise up the right side and not the left side? Would there by any conditions in which it rises up the left side of the U-tube?
2. What effect (increase, decrease, no effect) does an increase in temperature of a liquid have upon the …
- … average kinetic energies of the liquid particles?
- … rate at which evaporation occurs
- … rate at which condensation occurs
- … the number of particles remaining in the liquid state?
- … the height of the mercury column on the vapor’s side of the U-tube (i.e., left side)?
- … the vapor pressure of the liquid?
- … the boiling point of the liquid?
3. Evaluate each one of the following statements. Which of the following are true of a liquid and its vapor when at the equilibrium state?
- The amount of vapor present above the liquid is no longer changing.
- The rate at which condensation occurs is equal to the rate at which evaporation occurs.
- The liquid is said to be boiling.
- The evaporation process has ceased; liquid particles are no longer turning to vapor particles.
- The pressure of the vapor above the liquid is less than the vapor pressure.
4. Complete the following paragraph:
Increasing the temperature of a liquid causes its vapor pressure to __________ (increase, decrease, not be affected). This increase in temperature causes the average kinetic energy of liquid particles to __________ (increase, decrease, not longer be important). As such, there are ___________ (more, less, no) particles with a kinetic energy that exceeds the amount of kinetic energy required to escape the liquid state. As such, the rate of evaporation is _____________ (greater, smaller, non-existent) at increased temperatures. Once an equilibrium state is reached between the liquid and its vapor, there will be ________________ (more, less, about the same number of) particles in the vapor state. This explains why increasing the temperature causes the vapor pressure to __________ (increase, decrease, not be affected).
5. Use the plot of vapor pressure of water at varying temperatures to estimate the …
- … vapor pressure of water at 65°C.
- … vapor pressure of water at 85°C.
- … temperature at which the vapor pressure is 300 mm Hg.
- … temperature at which the vapor pressure is 700 mm Hg.
6. When in the liquid state at the same temperature, which one of the pair of substances would you expect to have the higher vapor pressure?
- Methane (CH4) or methanol (CH3OH)
- Diatomic oxygen (O2) or ozone (O3)
- Chlorine (Cl2(l)) or bromine (Br2(l))
- Ammonia (NH3) or phosphine (PH3)
- Ethane (C2H6) or octane (C8H18)
7. Evaluate the following statements and identify them as
TRUE or
FALSE.
- Compared to a more volatile liquid, a less volatile liquid has a higher boiling point.
- Compared to a more volatile liquid at the same temperature, a less volatile liquid has a higher vapor pressure.
- Compared to a more volatile liquid, a less volatile liquid has stronger intermolecular forces.