Hold down the T key for 3 seconds to activate the audio accessibility mode, at which point you can click the K key to pause and resume audio. Useful for the Check Your Understanding and See Answers.
Lesson 2: Properties of Liquids
Part a: Boiling and Melting
Part a: Boiling and Melting
Part b:
Vapor Pressure
Part c:
Surface Tension
Part d:
Capillary Action
Part e:
Viscosity
Changes of State
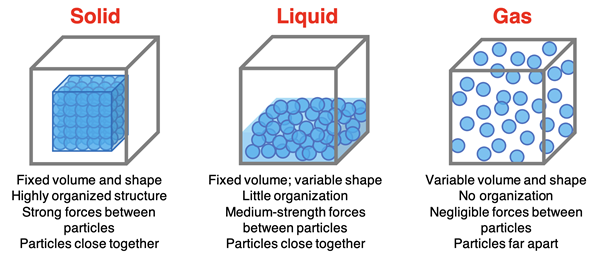
We first introduced the three common states of matter in Chapter 2. The particle diagram below was used to highlight the similarities and differences between the three states of matter.
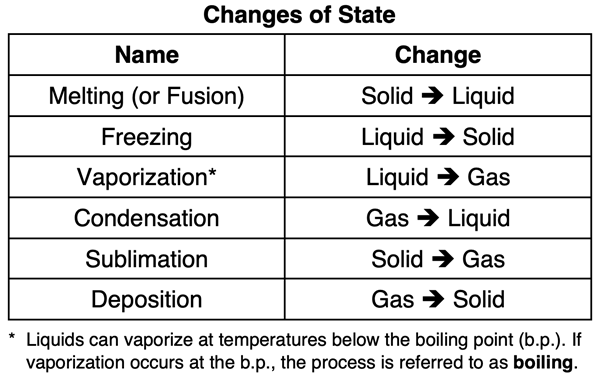
We know from our experiences with water that a solid can be changed to a liquid (and vice versa). A liquid can be changed to a gas (and vice versa). Even a solid can be changed to a gas (and vice versa). On this page, we will look in detail at the so-called state transitions between solids, liquids, and gases. We will look at the changes from a particle perspective. Before we begin, take a moment to review and re-familiarize yourself with the names given to these changes of state.
From -20°C to 120°C in Five Stages
Let’s do a thought experiment. Let’s suppose we have a large cube of ice and we place it in a dry, closed container at a temperature of -20°C and a pressure of 1 atm. The sample consists of water molecules in the solid state. Molecules are locked into a crystal lattice, held tightly together by the hydrogen bonding forces discussed in Lesson 1. The molecules can wiggle about their fixed position. They just can’t wiggle out of their fixed position because of the strong intermolecular forces that hold them in place.
Stage 1: Suppose that we slowly heat the -20°C container at a steady rate. Since ice is known to normally melt at a temperature of 0°C, heating the container does not melt the ice. The ice must first warm up to its melting temperature before it begins to melt. As heat is added, we observe the temperature of the ice gradually increasing. As temperatures increase, molecules of H2O(s) vibrate more and more vigorously … with greater and greater amplitude of vibration.
Stage 2: Once a temperature of 0°C is reached, the energy added to the container will melt the ice. This is a change of state. Molecule by molecule, the hydrogen bonding forces that hold the water in their crystal lattice are overcome. None of the added heat contributes to a temperature change. All of the added energy is used to by the water molecules to break free from the lattice. It is during this time, that the temperature would hold steady and both the liquid and the solid state could be observed in the sample.
 Stage 3: Once the last molecule of water has melted, the sample consists of liquid molecules. Molecules of liquid are not locked in a lattice. They can translate (fancy word for move from one location to another) and rotate. They move about and mix. They just have a bit of difficulty moving away and escaping the herd. Any molecule that does leave the herd will soon return to join back up with the rest of the pack. Hydrogen bonding forces still hold the particles down in a condensed state. But as more and more heat is added, the amount of translation and rotation increases. Molecules move faster. The ability of the intermolecular forces to hold them in the condensed state diminishes. Surface molecules escaping the herd is more a common observance at the higher temperatures. But once more, the molecules that escape return. (This escaping the herd is not boiling. It’s evaporation and we will discuss it more detail in the next part of Lesson 2.) Eventually, the sample reaches 100°C … a temperature which we refer to as the normal boiling point.
Stage 4: At the boiling point temperature, the transition of the liquid to a gas begins. The added heat is used to help the water molecules escape the liquid state and fill the container. None of the added energy contributes to a temperature change; it all contributes to the vaporizing of the water. During Stage 4, you will observe bubbles forming inside the bulk of the liquid and streaming to its surface to escape the liquid state. While evaporation occurs at the surface of a liquid, boiling occurs throughout the bulk of the liquid. As more heat is added, more water molecules have sufficient energy to overcome the hydrogen bonding, enter the gaseous state, and form bubbles that rise to the surface and escape. Yet the temperature stays the same. Both liquid and gaseous water are present during this transition stage. With increased heating, a higher percentage of the particles fill the entire container as the gaseous state until finally … there is no more liquid.
Stage 5: Once the last drop of liquid water has transitioned to gaseous water, the added heat contributes to an increase in the temperature of the gas. At higher temperatures, molecules of water are moving faster. Given that the container is closed, we will end our thought experiment here. Even in a thought experiment, heating a gas in a closed container is never a good idea.
 The graphic at the right summarizes the five stages of our thought experiment. Of the five stages, two of them involved a change of state - stages 2 and 4. During the transition stages, there were two states present and a constant temperature. The added heat contributed to the ability of the water molecules to overcome the intermolecular forces that held them in the particular state. The other three stages - stages 1, 3, and 5 - involved a temperature change. The added heat increased the amount of movement of the molecules. One thing that didn’t happen in any stage of the process - bonds holding H and O atoms in a molecule were never broken. The process started with water. The process ends with water. Only the state of matter has changed. Its identify has not.
Heating Curve
One way to describe the changes that occur in our thought experiment is to construct a plot of temperature versus the amount of heat added. The plot, known as a heating curve, is shown below.
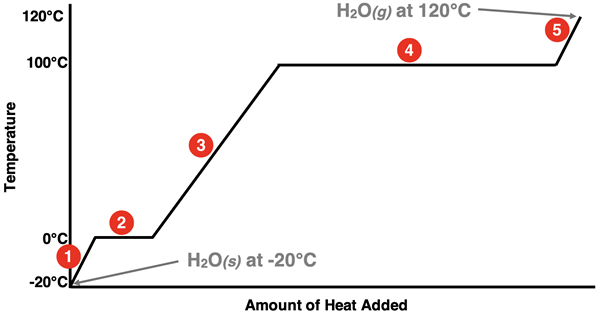
The numbers displayed next to the lines on the graph correspond to the five stages discussed earlier. There are three diagonal lines. These three lines represent a single state increasing its temperature towards a melting point or a boiling point. In stage 1, a sample of solid water increases its temperature towards the normal melting point. In stage 3, a sample of liquid water increases its temperature to the normal boiling point. Finally, in stage 5, a sample of gaseous water increases its temperature above the boiling point.
There are two plateaus on the graph. The plateaus represent the state changes. State changes are represented by plateaus or horizontal lines because there is no change in temperature during a state change. Stage 2 involves the melting of the ice or the transition from the solid to the liquid state. Stage 4 involves the boiling of the water or the transition from the liquid to the gaseous state.
Normal Melting Point and Boiling Point
The above discussion illustrates something important about melting and boiling. For a sample at a pressure of 1 atm, melting and boiling only happen at a specific temperature. For water, those temperatures are 0°C and 100°C. These are referred to as the normal melting point and the normal boiling point.
Normal Melting Point = the temperature at which a solid turns to a liquid under standard atmospheric pressure (1 atm).
Normal Boiling Point = the temperature at which a liquid turns to a gas under standard atmospheric pressure (1 atm).
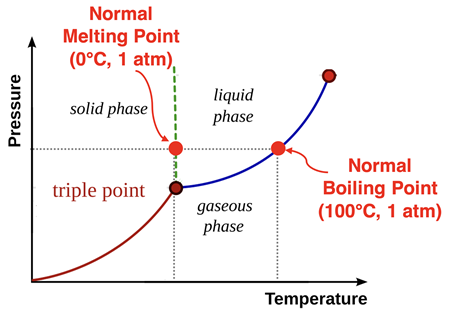
Why such an emphasis on pressure? It ends up, that water doesn’t always boil at 100°C. The actual temperature at which water transitions between liquid and gas states is dependent upon pressure. (We will have more to say about this in
the next part of Lesson 2.) The so-called
phase diagram for water is shown at the right. The normal melting point and normal boiling point are indicated on the diagram. The blue line on the graph represents the various pressure-temperature conditions for which water transitions between liquid and gas phase. The fact that this blue line is a
curved diagonal means that the temperature at which the liquid turns to a gas is highly dependent upon the pressure. The green line on the graph represents the various pressure-temperature conditions for which water transitions between solid and liquid phase. The fact that the green line is rather vertical means that the melting point of water has very little dependence upon the pressure.
The values of melting point and boiling point are indicators of the strength of the intermolecular attractions between particles. Higher melting points and boiling points correlate with stronger intermolecular forces. When comparing different substances, those with the higher transition temperatures are characterized by particles with greater attractions for one another.
Before You Leave
- Download our Study Card on Melting and Boiling. Save it to a safe location and use it as a review tool. (Coming Soon.)
- Perhaps our best application of this lesson's material is our Science Reasoning Activity titled Heating Curves. Give it a try!
- Try Science Reasoning Activity titled Melting Points and Boiling Points. The activity makes a great follow-up to this lesson.
- Explore our Phase Change simulation. Study the simulation. Then check your understanding with our accompanying Concept Checker.
- The Check Your Understanding section below include questions with answers and explanations. It provides a great chance to self-assess your understanding.
Check Your Understanding
Use the following questions to assess your understanding. Tap the Check Answer buttons when ready.
1. Increasing the temperature of a sample of water at temperatures below its melting point causes the molecules of water to _______. Choose all that apply.
- translate or move about the container at high speeds.
- rotate about with a higher rate of revolution.
- vibrate more vigorously about its fixed position.
2. Increasing the temperature of a sample of water at temperatures above its melting point causes the molecules of water to _______. Choose all that apply.
- translate or move about the container at high speeds.
- rotate about with a higher rate of revolution.
- vibrate more vigorously about its fixed position.
3. Identify the following statements as being
TRUE or
FALSE.
- As solid water is heated from -20°C to 0°C, more and more of the solid melts until 0°C is reached. At 0°C, all the water has melted.
- It is possible to add heat to a sample of water and not have it change its temperature.
- During Stage 2, liquid water is warming up and getting ready to rapidly increase its temperature.
- There is no liquid present in the sample during Stage 4.
- A change of state occurs at a constant temperature.
4.
TRUE or
FALSE: Pure water always boils at 100°C.
5. Substance A has a higher melting point than substance B. What can be concluded about these two substances?
- Substance A is at a higher temperature than substance B.
- Substance A warms up a lot faster than substance B.
- The intermolecular forces in substance A are stronger than the IMFs in substance B.
- The intermolecular forces in substance B are stronger than the IMFs in substance A.