Using Graphs
The Using Graphs Concept Builder is composed of three activities. Questions in the Concept Builder are organized into 13 Question Groups. Questions in the same Question Group are very similar. To complete an activity, a student must demonstrate mastery of all Question Groups. The three activities are described as follows:
- Calculating Slope: Question Groups 1-6; students calculate the slope and indicate the units on the slope
- For Every ...: Question Groups 7-9; students interpret the slope in order to identify an appropriate "For every statement."
- Predict!: Question Groups 10-13; students extrapolate in order to determine an unknown quantity.
The activities can be done independent of each other. For instance, the For Every ... activity can be done without doing the Calculating Slope activity or the first and third activities can be done without doing the second activity. Teachers are encouraged to view the questions in order to judge which activity is most appropriate for their classes.
The Physics Classroom grants teachers and other users the right to print these questions for private use. Users are also granted the right to copy the text and modify it for their own use. However, this document should not be uploaded to other servers for distribution to and/or display by others. The Physics Classroom website should remain the only website or server from which the document is distributed or displayed. We also provide a PDF that teachers can use under the same conditions. We have included a link to the PDF near the bottom of this page.
Using Graphs
Activity 1: Calculating Slope
Question Group 1
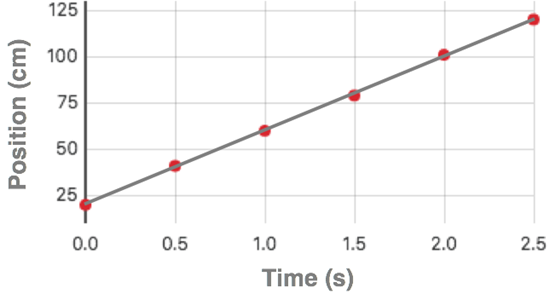
Question 1:
The graph shows a toy car’s position as a function of time. Determine the slope of the line and indicate the units on the slope.
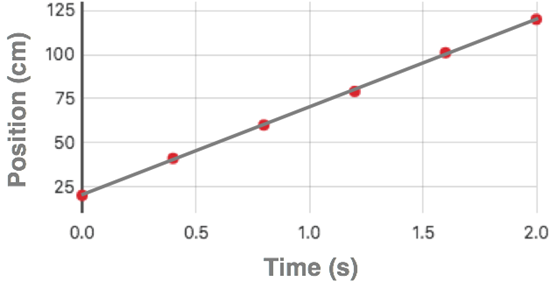
Question 2:
The graph below a toy car’s position as a function of time. Determine the slope of the line and indicate the units on the slope.
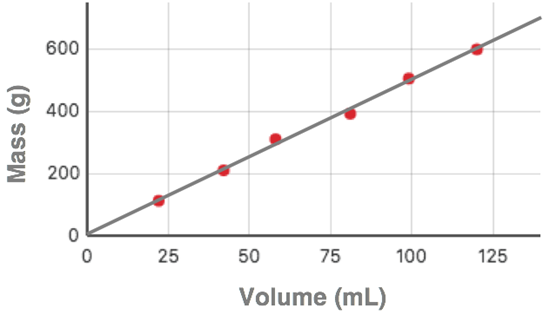
Question 3:
The graph below shows a toy car’s position as a function of time. Determine the slope of the line and indicate the units on the slope.

Question Group 2
Question 4:
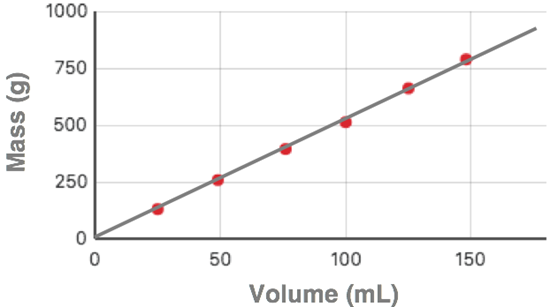
The graph shows the mass of samples of a metal as a function of its volume. Determine the slope of the line and indicate the units on the slope.
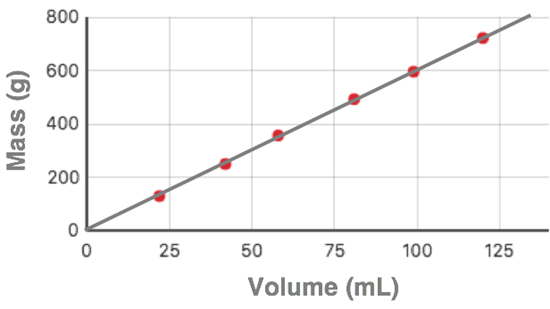
Question 5:
The graph below shows the mass of samples of a metal as a function of its volume. Determine the slope of the line and indicate the units on the slope.
Question 6:
The graph below shows the mass of a of samples of a metal as a function of its volume. Determine the slope of the line and indicate the units on the slope.
Question Group 3
Question 7:
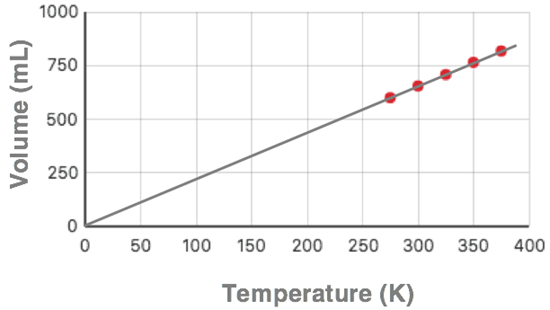
The graph shows the volume of a sample of gas as a function of temperature. Determine the slope of the line and indicate the units on the slope.
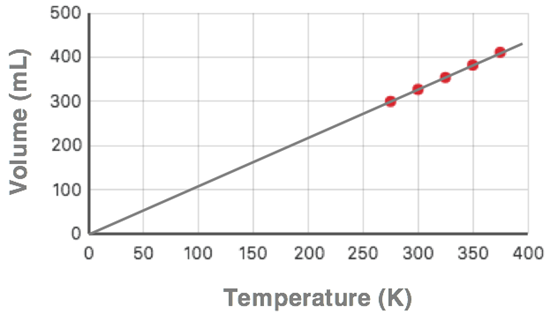
Question 8:
The graph below shows the volume of a sample of gas as a function of temperature. Determine the slope of the line and indicate the units on the slope.
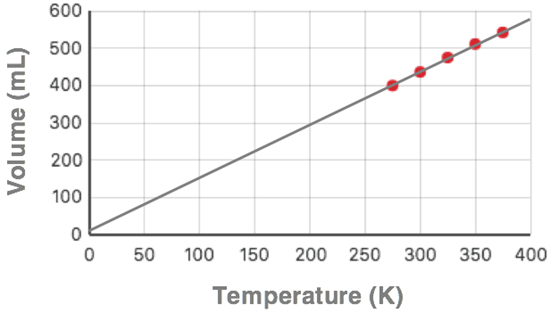
Question 9:
The graph below shows the volume of a sample of gas as a function of temperature. Determine the slope of the line and indicate the units on the slope.
Question Group 4
Question 10:
The graph shows the electrical resistance of a wire as a function of its length. Determine the slope of the line and indicate the units on the slope.
Question 11:
The graph below shows the electrical resistance of a wire as a function of its length. Determine the slope of the line and indicate the units on the slope.
Question 12:
The graph below shows the electrical resistance of a wire as a function of its length. Determine the slope of the line and indicate the units on the slope.

Question Group 5
Question 13:
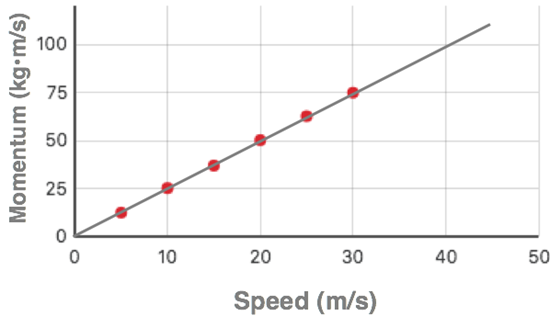
The graph shows the momentum of an object as a function of its speed. Determine the slope of the line and indicate the units on the slope.
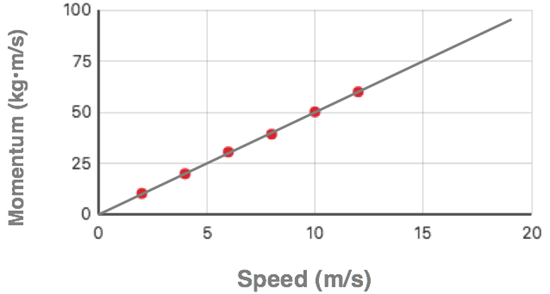
Question 14:
The graph below shows the momentum of an object as a function of its speed. Determine the slope of the line and indicate the units on the slope.
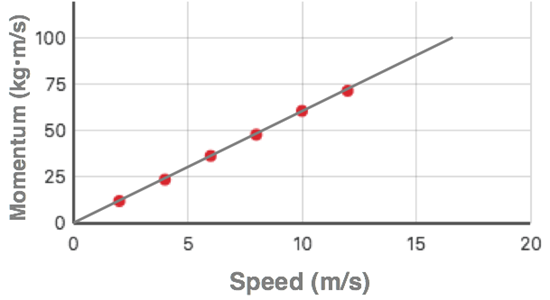
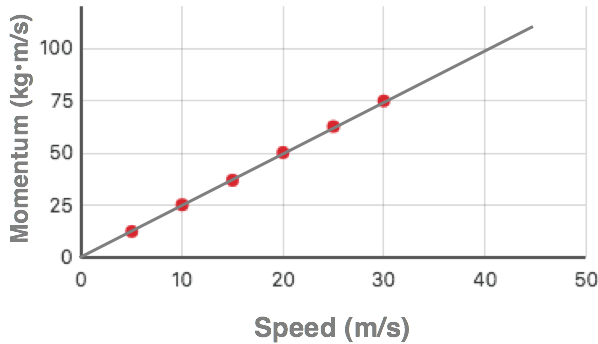
Question 15:
The graph below shows the momentum of an object as a function of its speed. Determine the slope of the line and indicate the units on the slope.
Question Group 6
Question 16:
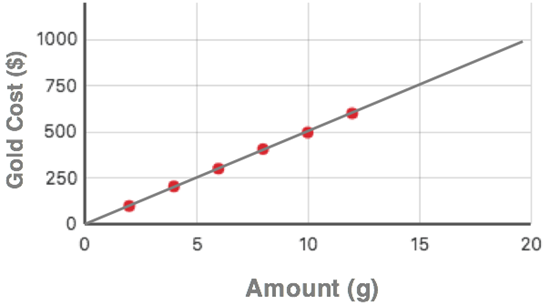
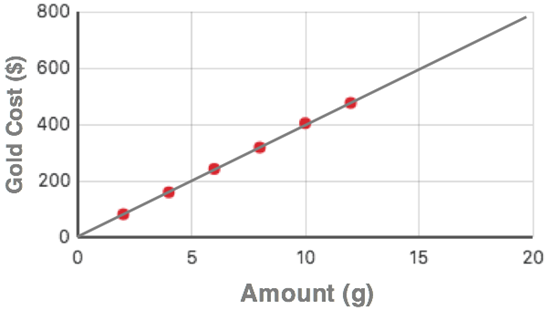
The graph shows the cost of gold as a function of its amount. Determine the slope of the line and indicate the units on the slope.

Question 17:
The graph below shows the cost of gold as a function of its amount. Determine the slope of the line and indicate the units on the slope.
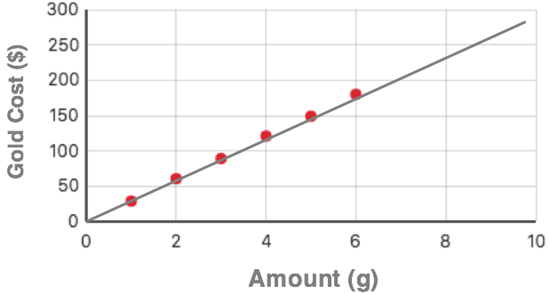
Question 18:
The graph below shows the cost of gold as a function of its amount. Determine the slope of the line and indicate the units on the slope.
Activity 2: For Every Statements
Question Group 7
 Question 19:
For Every statements are often used to describe the relationship between two quantities. Which one of the For Every statements is consistent with the graph?
A. For every 1.0 second change in time, there is a 40 cm change in position.
B. For every 1.0 second change in time, there is a 60 cm change in position.
C. For every 1.0 second change in time, there is a 120 cm change in position.
D. For every 1.0 cm change in position, there is a 40 s change in time.
E. For every 1.0 cm change in position, there is a 60 s change in time.
Question 20:
 For Every statements are often used to describe the relationship between two quantities. Which one of the For Every statements is consistent with the graph?
A. For every 1.0 second change in time, there is a 50 cm change in position.
B. For every 1.0 second change in time, there is a 70 cm change in position.
C. For every 1.0 second change in time, there is a 120 cm change in position.
D. For every 1.0 cm change in position, there is a 50 s change in time.
E. For every 1.0 cm change in position, there is a 70 s change in time.
Question 21:
 For Every statements are often used to describe the relationship between two quantities. Which one of the For Every statements is consistent with the graph?
A. For every 1.0 second change in time, there is a 40 cm change in position.
B. For every 1.0 second change in time, there is a 90 cm change in position.
C. For every 1.0 second change in time, there is a 250 cm change in position.
D. For every 1.0 cm change in position, there is a 40 s change in time.
E. For every 1.0 cm change in position, there is a 90 s change in time.
Question Group 8
Question 22:
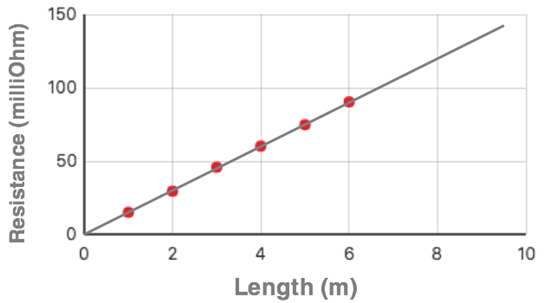
 For Every statements are often used to describe the relationship between two quantities. Which one of the For Every statements is consistent with the graph?
A. For every 1.0 m change in length, there is a 15 milliOhm change in resistance.
B. For every 1.0 m change in length, there is a 90 milliOhm change in resistance.
C. For every 1.0 m change in length, there is a 150 milliOhm change in resistance.
D. For every 1.0 milliOhm change in resistance, there is a 15 m change in length.
E. For every 1.0 milliOhm change in resistance, there is a 90 m change in length.
Question 23:
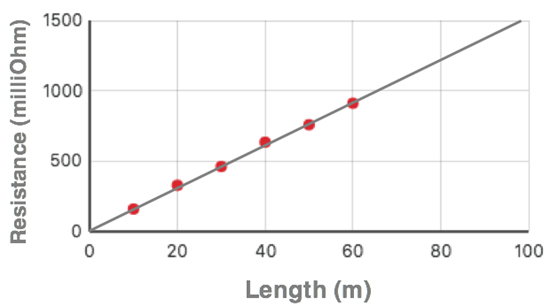
 For Every statements are often used to describe the relationship between two quantities. Which one of the For Every statements is consistent with the graph?
A. For every 1.0 m change in length, there is a 15 milliOhm change in resistance.
B. For every 1.0 m change in length, there is a 900 milliOhm change in resistance.
C. For every 1.0 m change in length, there is a 1500 milliOhm change in resistance.
D. For every 1.0 milliOhm change in resistance, there is a 15 m change in length.
E. For every 1.0 milliOhm change in resistance, there is a 900 m change in length.
Question 24:
 For Every statements are often used to describe the relationship between two quantities. Which one of the For Every statements is consistent with the graph?
A. For every 1.0 m change in length, there is a 16 milliOhm change in resistance.
B. For every 1.0 m change in length, there is a 95 milliOhm change in resistance.
C. For every 1.0 m change in length, there is a 150 milliOhm change in resistance.
D. For every 1.0 milliOhm change in resistance, there is a 16 m change in length.
E. For every 1.0 milliOhm change in resistance, there is a 95 m change in length.
Question Group 9
Question 25:
 For Every statements are often used to describe the relationship between two quantities. Which one of the For Every statements is consistent with the graph?
A. For every 1.0 g change in mass, there is a 40 dollar change in cost.
B. For every 1.0 g change in mass, there is a 480 dollar change in cost.
C. For every 1.0 g change in mass, there is a 800 dollar change in cost.
D. For every 1.0 dollar change in cost, there is a 40 g change in mass.
E. For every 1.0 dollar change in cost, there is a 480 g change in mass.
Question 26:
 For Every statements are often used to describe the relationship between two quantities. Which one of the For Every statements is consistent with the graph?
A. For every 1.0 g change in mass, there is a 50 dollar change in cost.
B. For every 1.0 g change in mass, there is a 600 dollar change in cost.
C. For every 1.0 g change in mass, there is a 1000 dollar change in cost.
D. For every 1.0 dollar change in cost, there is a 50 g change in mass.
E. For every 1.0 dollar change in cost, there is a 600 g change in mass.
Question 27:
 For Every statements are often used to describe the relationship between two quantities. Which one of the For Every statements is consistent with the graph?
A. For every 1.0 g change in mass, there is a 30 dollar change in cost.
B. For every 1.0 g change in mass, there is a 180 dollar change in cost.
C. For every 1.0 g change in mass, there is a 300 dollar change in cost.
D. For every 1.0 dollar change in cost, there is a 30 g change in mass.
E. For every 1.0 dollar change in cost, there is a 180 g change in mass.
Activity 3: Making Predictions from Graphical Data
Question Group 10
Question 28:
The graph shows the volume of a sample of gas as a function of temperature. Use the graph to determine the volume of the sample at a temperature of 100 K.
Question 29:
The graph shows the volume of a sample of gas as a function of temperature. Use the graph to determine the volume of the sample at a temperature of 200 K.
Question 30:
The graph shows the volume of a sample of gas as a function of temperature. Use the graph to determine the volume of the sample at a temperature of 225 K.
Question Group 11
Question 31:
The graph shows the electrical resistance of a wire as a function of its length. Use the graph to determine the resistance (in milliOhms) of an 8.0-m long wire.
Question 32:
The graph shows the electrical resistance of a wire as a function of its length. Use the graph to determine the resistance (in milliOhms) of an 80.0-m long wire.
Question 33:
The graph shows the electrical resistance of a wire as a function of its length. Use the graph to determine the resistance (in milliOhms) of an 9.0-m long wire.
Question Group 12
Question 34:
The graph shows the momentum of an object as a function of its speed. Use the graph to determine the momentum (in kg•m.s) of the object if it moves at 15.0 m/s.
Question 35:
The graph shows the momentum of an object as a function of its speed. Use the graph to determine the momentum (in kg•m.s) of the object if it is moving at 15.0 m/s.
Question 36:
The graph shows the momentum of an object as a function of its speed. Use the graph to determine the momentum (in kg•m.s) of the object if it is moving at 40.0 m/s.
Question Group 13
Question 37:
The graph shows the cost of gold as a function of its amount. Use the graph to determine the cost (in dollars) of 15.0 g of gold.
Question 38:
The graph shows the cost of gold as a function of its amount. Use the graph to determine the cost (in dollars) of 15.0 g of gold.
Question 39:
The graph shows the cost of gold as a function of its amount. Use the graph to determine the cost (in dollars) of 8.0 g of gold.