Hold down the T key for 3 seconds to activate the audio accessibility mode, at which point you can click the K key to pause and resume audio. Useful for the Check Your Understanding and See Answers.
Lesson 4: Periodic Trends
Part b: Atomic Size
Part 4a:
The Periodic Law Revisited
Part 4b: Atomic Size
Part 4c:
Ionization Energy
Part 4d:
Electronegativity
What is Atomic Radius?
The size of atoms is a periodic property. When progressing from element to element in order of atomic number, there is a pattern of change that repeats itself over and over again. The best means of expressing the size of atoms is by means of a measurable quantity known as t he atomic radius.
Measuring atomic radius uses an x-ray imaging technique known as x-ray diffraction. The distance is measured from the center of one atom to the center of an identical atom that is bonded to it. This is the interatomic distance. The atomic radius is one-half the interatomic distance. The atomic radius is typically expressed in the unit picometer, abbreviated pm. Atoms of noble gases do not form bonds with themselves. Empirical data for the atomic radii of the noble gas elements must be determined by other methods.
A Look at the Data
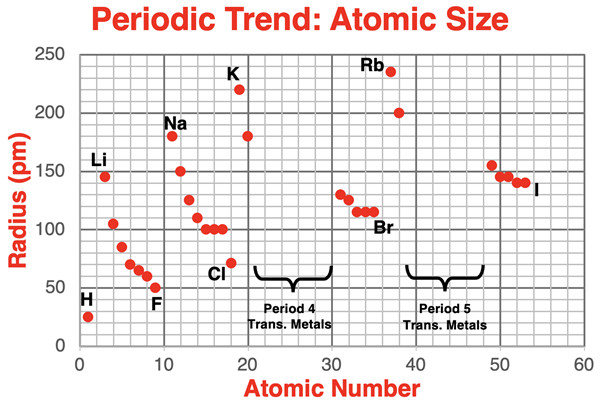
The plot below displays atomic radius values as a function of atomic number for the first five periods of the periodic table. Transition metals do not show any meaningful trends. They have been left out of the data set.

The alkali metals and the halogen data points have been labeled on the chart. The pattern of change or trend from Li to F (period 2), from Na to Cl (period 3), from K to Br (period 4), and from Rb to I (period 5) is clearly evident. The pattern of a decreasing atomic radius value repeats itself during each of these periods.
A Pictorial Representation
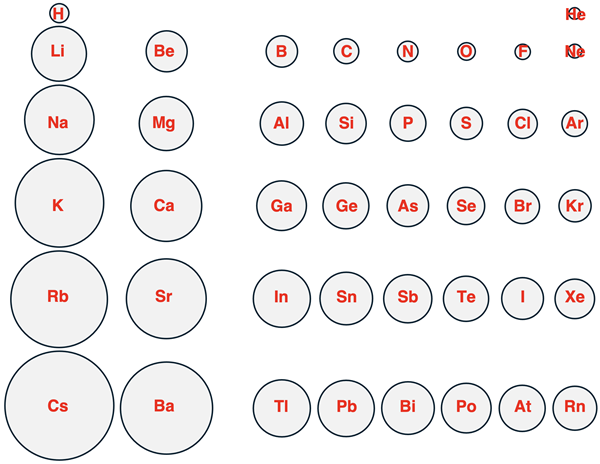
A more revealing way of looking at this data is by representing each element as a circle that has a radius that is proportional to the atomic radius. This is done below for main group elements in periods 1 through 6.

Each column represents a group, beginning with group 1 on the left and ending with group 18 on the right. (Transition metals in groups 3 – 12 are not included in the graphic.) Each row of the graphic represents a period, with period 1 (includes H and He) at the top and period 6 (Cs through Rn) at the bottom.
Describing the Trends
Two trends can be identified in the above pictorial representation.
- As one proceeds from top to bottom down a column of the Periodic Table, the atomic radius increases.
- As one proceeds from left to right across a row of the Periodic Table, the atomic radius decreases.
Explaining the Trends
The modern model of the atom is used to explain the two trends. When progressing from atom to atom down a group of the periodic table,
the number of valence electrons remains constant. But in each successive row, the
valence electrons are entering orbitals of a different
principal energy level (n). Orbitals with a larger n value (at the bottom of the table) are larger orbitals. Thus, it makes sense that atomic radius increases as one progresses down a group.
When progressing from element to element across a period of the periodic table, one electron and one proton are being added with each successive element. The electrons are entering into the same
valence shell. But the addition of a proton causes the size of the shell to be contracted in size. The contraction is the result of an even more positively charged nucleus attracting the negatively charged electron cloud and drawing it inward. Thus, elements on the far right of a period, with a larger number of protons, are smaller than elements on the far left that have less protons.
Before You Leave
- Practice. Try our Periodic Trends Concept Builder. It’s great practice! The first of the three activities pertains to atomic radius.
- Download our Study Card on Periodic Trends. Save it to a safe location and use it as a review tool. This Study Card covers Lesson 4b – Lesson 4d.
- The Check Your Understanding section below include questions with answers and explanations. It provides a great chance to self-assess your understanding.
Check Your Understanding
Use the following questions to assess your understanding. Tap the Check Answer buttons when ready.
1. For each set of three elements, use the periodic trends to rank the elements in order of increasing atomic radii:
- 20Ca, 31Ga, 35Br
- 5B, 31Ga, 81Tl
- 9F, 16S, 17Cl
- 4Be, 11Na, 12Mg
- 8O, 38Sr, 52Te
- 16S, 81Tl, 84Po