Hold down the T key for 3 seconds to activate the audio accessibility mode, at which point you can click the K key to pause and resume audio. Useful for the Check Your Understanding and See Answers.
Lesson 3: Measurements in Chemistry
Part c: Evaluating Results
Part 3a: Precision and Uncertainty
Part 3b: Significant Digits
Part 3c: Evaluating Results
A Thought Experiment
Think on this for a moment: Let’s suppose that you are doing a lab with the
Purpose of
determining the percent sugar in a solution. Your teacher has prepared several solutions and has given each lab group a unique solution. Because she prepared the solutions, she knows the answer to the lab question. That is, she knows the percent sugar in each solution.
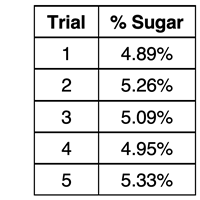
Your lab group carefully conducts five trials using the prescribed multi-step procedure and determines the percent sugar in the solution. Your results for the five trials are shown at the right. We want to discuss on this page how you would evaluate your results? What next steps could you take to answer the question
How well did our lab group do? That is the focus of this page.
Evaluation Measures for Lab Results
There are a variety of criteria that can be used to evaluate lab results. Many of these have a statistical flavor to them. We will center our discussion on the criteria of
accuracy and
precision. Evaluating lab results using these criteria can shed light on the care and the skill taken by the students performing the lab. But it also can shed light on how useful the procedure and the equipment are in collecting the data.
In the thought experiment provided above, we presume that the teacher knows the
correct answer; she knows the percent sugar in each lab groups solution. We usually refer to this as the
theoretical value. In theory, this is the value that a perfect lab group would determine when they conducted their experiment. The values represented in the table above are what we would refer to as the
experimental value; there are five such values for your lab group. We can also calculate an
average experimental value. As you would expect, the values for the five trials could be added and divided by five.
Average Experimental Value = 5.10 %
How can the theoretical value, the experimental values, and the average value be used to evaluate the lab results? And where does accuracy and precision fit into this discussion?
Representing and Evaluating Data
It is at this point in a typical science textbook that the discussion turns towards a comparison of accuracy and precision. There are usually two or more
dart board diagrams displayed. We’ve never really understood those dart board diagrams (if you get our point), so we are going to instead display some scatter plots of the results for several student lab groups. W will also display the average experimental value and the theoretical value. We will represent these values on the scatter plots by dashed lines.
Think of the theoretical value as the
target. It’s like the correct answer (since we know it was determined by a teacher … and they never make mistakes). Each one of the
experimental values on the scatter plot represents the lab group’s
attempt at hitting the target. Those attempts (experimental values) could be very close to the target (theoretical value) or very far from the target.
The scatter plots below represent your lab group’s results and the results for three other lab groups.
Analyzing Accuracy
Let’s analyze the four sets of results, beginning with the concept of
accuracy. An accurate trial is a trial in which the experimental value is relatively close to the theoretical value (the target). An accurate experiment (group of trials) is an experiment in which the average experimental value is relatively close to the theoretical value or target. The plotted points represent the experimental values. The red dashed line is the target – the theoretical value. And the blue dashed line is the average of all experimental values. Lab Groups 1 and 4 have the most accurate experimental results. The average experimental value is very close to the theoretical value. It’s worth noting that for Lab Group 4 very few of its individual trials resulted in values that were close to the theoretical value; but their average worked out nicely. Most trials had little agreement with the theoretical. Lab Group 3 has experimental results that are certainly better than Group 2, but they still lack the accuracy of Lab Groups 1 and 4.
Analyzing Precision
We discussed
precision of measurement earlier in Lesson 3. In the discussion, we related measurement precision to the number of divisions on the measuring instrument. This impacts the number of significant digits that can be acquired from the instrument. Instruments with lots of divisions are very precise and have a low uncertainty. We learned to write statements like …
Volume reading = 38.21 mL ± 0.05 mL
to describe the level of precision and uncertainty in a measurement.
Now is where we have to be careful! We are now going to use the term precision to describe experimental results, not a specific measurement. In our thought experiment, there were likely several measurements made and some subsequent calculations for each trial. The uncertainties for each measurement can easily add up to a much larger uncertainty. Additionally, there may have been some errors in how the procedure was conducted. There may have been spills, dirty glassware, incomplete transfers of a measured volume from one container to another container, etc. All of this can contribute to experimental results that are widely varied from one another.
When all calculations are complete and a % sugar value has been determined for five trials, we can make judgements regarding the overall
precision of the experiment. Unlike the previous discussion of measurement precision, here we are using precision to describe a set experimental results. Used in this way, high precision means the results tend to agree with one another. They were approximately the same value from one trial to the next trial.
Now let’s consider the concept of
precision as we analyze the results of the four lab groups. Each lab group repeated the procedure for five trials with the same sugar solution. If the procedure is valid and carefully performed, we would expect results to show very little variance from trial to trial. When results from trial to trial agree with one another, we describe the results as being precise. They provide a sense of certainty regarding the result. Given this definition, we would conclude that Lab Groups 1 and 3 had very precise results. In contrast, Lab Groups 2 and 4 had results that displayed lots of variation from trial to trial and had a low precision and a high level of uncertainty.
Summary of Accuracy and Precision
Our analysis can be summarized as follows:
Quantifying Precision with Uncertainty
A typical evaluation of lab results will include some quantitative measures. The three most common calculations are of uncertainty, percent error, and percent difference. Uncertainty calculations provide insight into the precision of the lab results. The most standard method of calculating the uncertainty involves determining the difference between the highest and the lowest result and then dividing by two. That is, find the range of determined values for the percent sugar in the solution; then divide the range by two. This is illustrated below.
Note again that the two groups with the highest precision – Groups 1 and 3 – had the lowest uncertainty values. There was very little difference between their high measurement and their low measurement.
Quantifying Accuracy with Percent Error Calculations
Another common means of evaluating the results of an experiment involves a
percent error calculation. A percent error is typically calculated from the average experimental value and the theoretical value. If the theoretical value is not known (and sometimes it isn’t), then the percent error cannot be calculated. In this thought experiment, the theoretical value is provided by the teacher who prepared the solution. The formula for percent error is …
It is common to include absolute values for percent error. If you do not, then a negative percent error could result. This means the experimental value was less than the theoretical value. The table below shows the percent error calculation for all four lab groups.
Percent Difference Calculations
A final means of evaluating the results of an experiment involves a
percent difference calculation. A percent difference involves taking the difference between two values and dividing it by the average of the two values and then multiplying by 100. Absolute values are often used in the calculation. The formula for a generic percent difference calculation is …
Percent difference calculations are often used to evaluate the precision of individual trials. The denominator is the average experimental value. The numerator is the difference between the individual trial value and the average experimental value.
Percent difference calculations are displayed in the table below for Lab Group 1. The fact that the percent differences are all very low (close to 0%) is consistent with the fact that Lab Group 1 had precise experimental results. There was very little difference between the values for the individual trials and the average values.
Outliers
On occasion a lab group will end up with an outlier. An
outlier is a data point or trial result that seems widely out of place when compared to the general trend of the other data points or trial results. Outliers tend to skew the experimental results and may lead to incorrect conclusions. Because of this, outliers are usually not included as part of the analysis of results. The outlier should remain in the data set but does not need to be included in the averaging and subsequent analysis. Simply cross out or
X-out the data point in any graph or data table.
The data set and graph below illustrate an outlier in an experiment. The value for Trial 4 does not conform to the general pattern established by the other trials. This trial would not be included in the calculation of the experimental average.
Check Your Understanding
Use the following questions to assess your understanding. Tap the
Check Answer buttons when ready.
1. Recall that Lab Group #3 had experimental results that had high precision but only a fair accuracy. Their results are displayed below. It ends up that they were working at the same lab station as Lab Group #7. Lab Group #7 had the same type of results – high precision and fair accuracy. Their data is displayed below.
Which one of the following explanations might explain the results of these two lab groups?
a. The station is likely haunted by laboratory gremlins that skew experimental results.
b. The equipment at this station is flawed resulting in all sorts of lab error.
c. The reagents (chemicals) used to conduct the study were ill-prepared, causing the lab groups to under-shoot the target value (i.e., the theoretical value)
d. The two lab groups unknowingly switched their solutions at the beginning of the lab and were analyzing the wrong solution.