Hold down the T key for 3 seconds to activate the audio accessibility mode, at which point you can click the K key to pause and resume audio. Useful for the Check Your Understanding and See Answers.
 As discussed in the previous part of Lesson 3, the slope of a position vs. time graph reveals pertinent information about an object's velocity. For example, a small slope means a small velocity; a negative slope means a negative velocity; a constant slope (straight line) means a constant velocity; a changing slope (curved line) means a changing velocity. Thus the shape of the line on the graph (straight, curving, steeply sloped, mildly sloped, etc.) is descriptive of the object's motion. In this part of the lesson, we will examine how the actual slope value of any straight line on a graph is the velocity of the object.
Consider a car moving with a constant velocity of +10 m/s for 5 seconds. The diagram below depicts such a motion.
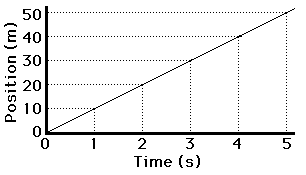
 The position-time graph would look like the graph at the right. Note that during the first 5 seconds, the line on the graph slopes up 10 m for every 1 second along the horizontal (time) axis. That is, the slope of the line is +10 meter/1 second. In this case, the slope of the line (10 m/s) is obviously equal to the velocity of the car. We will examine a few other graphs to see if this a principle that is true of all position vs. time graphs.
Now consider a car moving at a constant velocity of +5 m/s for 5 seconds, abruptly stopping, and then remaining at rest (v = 0 m/s) for 5 seconds.
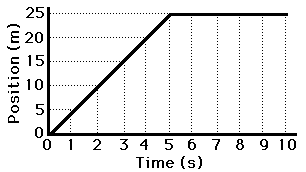
 If the position-time data for such a car were graphed, then the resulting graph would look like the graph at the right. For the first five seconds the line on the graph slopes up 5 meters for every 1 second along the horizontal (time) axis. That is, the line on the position vs. time graph has a slope of +5 meters/1 second for the first five seconds. Thus, the slope of the line on the graph equals the velocity of the car. During the last 5 seconds (5 to 10 seconds), the line slopes up 0 meters. That is, the slope of the line is 0 m/s - the same as the velocity during this time interval.
 Both of these examples reveal an important principle. The principle is that the slope of the line on a position-time graph is equal to the velocity of the object. If the object is moving with a velocity of +4 m/s, then the slope of the line will be +4 m/s. If the object is moving with a velocity of -8 m/s, then the slope of the line will be -8 m/s. If the object has a velocity of 0 m/s, then the slope of the line will be 0 m/s.
Investigate!
The widget below plots the position-time plot for an object moving with a constant velocity. Simply enter the velocity value, the intial position, and the time over which the motion occurs. The widget then plots the line with position on the vertical axis and time on the horizontal axis.
We Would Like to Suggest ...

Sometimes it isn't enough to just read about it. You have to interact with it! And that's exactly what you do when you use one of The Physics Classroom's Interactives. We would like to suggest that you combine the reading of this page with the use of our
Graph That Motion or our
Graphs and Ramps Interactives. Each is found in the Physics Interactives section of our website and allows a learner to apply concepts of kinematic graphs (both position-time and velocity-time) to describe the motion of objects.