 Chart That Motion
Resource:
Physics Interactives - Chart That Motion
Grade Level: High School
Description:
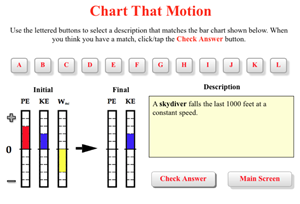
This activity is an online, interactive energy bar chart tool that assesses student understanding of the work/energy relationship. The Interactive displays 12 different energy bar charts and asks students to choose which verbal description matches the bar chart. A built-in scoring system allows teachers to easily monitor student progress on the activity. This HTML5 Interactive works will on iPads and other tablets and on Chromebooks, making it an excellent choice for the 1:1 classroom environment.
This activity aligns with the three dimensions of the Next Generation Science Standards in the manner described below:
| Definitions of Energy (HS-PS3.A.1): Energy is a quantitative property of a system that depends on the motion and interactions of matter within that system. That there is a single quantity called energy is due to the fact that a system’s total energy is conserved, even as, within the system, energy is continually transferred from one object to another and between its various possible forms. |
Energy Bar Charts are a common tool in the physics classroom. This interactive version requires a greater depth of student reasoning to match the energy to a written description of the motion. As they do the task, the visual displays help students to recognize that energy is something that can be kept track of. They must make decisions about the amounts of the various forms of energy as the object moves from one state to another state. |
| Conservation of Energy and Energy Transfer (HS-PS3.B.1): Conservation of energy means that the total change of energy in any system is always equal to the total energy transferred into or out of the system. |
As students make decisions about the work-energy bar charts in this activity, they are conducting a mental book-keeping of the energy within the system and the energy that transfers across the system boundary due to work. This book-keeping reflects itself in the choices that students make for the height of the KE and PE bars (energy in the system) and the height of the W bar (energy transferred between system and surroundings). |
| Energy and Matter - Flows, Cycles, and Conservation: Energy cannot be created or destroyed – it only moves between one place and another place, between objects and/or fields, or between systems. |
The Energy Bar Chart tool requires deep analytical reasoning to determine which written description accurately matches which chart. It will be almost impossible for a student to fake it and produce correct responses. They must be able to recognize how energy changes form from kinetic to potential and vice versa. They must also be able to identify when energy is transferred into and out of the system as work is done on the system. |
Scale, Proportion, and Quantity: In considering phenomena, it is critical to recognize what is relevant at different measures of size, time, and energy. Algebraic thinking is used to examine scientific data and predict the effect of a change in one variable on another.
|
Students use information about speed and height of a moving object to rationalize the relative amount of kinetic and potential energy in the intial and final state of the object.They identify the relative height of a bar on a bar chart based on this information. Implicit to such an ability is the recognition that intial energy pluw work done is equal to the final amount of energy. Thus a loss of KE is an indicator of either negative work being done or a potential energy gain. |
| High School – Analyzing and Interpreting Data: Analyze data using tools, technologies, and/or models (e.g. computational, mathematical) in order to make valid and reliable scientific claims. |
Students must use the work-energy model in order to analyze a physical situation regarding the motion of an object between initial and final states. After analysis of the description, they draw conclusions regarding which work-energy bar chart that corresponds to the situation. |
Associated Reading from The Physics Classroom
Other Supporting Pages at The Physics Classroom:
View Infographic
(Coming soon)
Search the NGSS Corner
Maybe you're looking for something really specific that pertains to a desired topic and emphasizes one or more of the listed NGSS dimensions. Why not try a search of this section of our website? Simply select from one or more of the pull-down menus and click Search. This page will reload and a collection of possibilities will be displayed in this section of the page and sorted by relevancy.