 Standing Waves on a Rope
Resource:
The Science Reasoning Center: Standing Waves on a Rope
Grade Level: High School
Description:
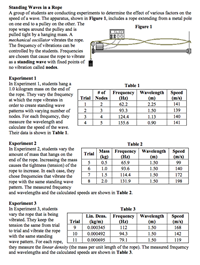
This passage describes a collection of three experiments investigating the possible effect of three different variables upon the speed of a standing wave. The experiments are described and frequency-wavelength-speed data are presented in tables. Questions target a student's ability to understand the design of an experiment, to combine results from two or more data presentations in order to draw appropriate conclusions, to interpolate and extrapolate from data in a table, to predict the results of an additional trial, to translate information from a data table to a graph, and to make predictions based upon a model.
Performance Expectation:
HS-PS4-1 Use mathematical representations to support a claim regarding relationships among the frequency, wavelength, and speed of waves traveling in various media.
This activity aligns with the three dimensions of the Next Generation Science Standards in the manner described below:
| Wave Properties (HS-PS4.A.1): Wavelength and frequency of a wave are related to one another by the speed of travel of the wave, which depends on the type of wave and the medium through which it is passing. |
In this passage students will gain an appreciation for an important wave relationship—namely that wave speed is the product of wavelength and frequency. Students will do so by investigating three experiments of standing waves formed on a rope driven by a frequency generator and motor. Students will discover that while changing the frequency does not affect wave speed, changing the medium (tension in the rope or type of rope) does alter the speed of waves. |
| Scale, Proportion, and Quantity: Algebraic thinking is used to examine scientific data and predict the effect of a change in one variable on another (e.g., linear growth vs. exponential growth). |
In this passage and the questions that follow, students explore factors that affect the speed of waves on a rope. As students consider three experiments and the data collected in each, they are asked to determine the effect of changing one variable (frequency, rope tension, rope type) on another (wave speed). One valuable outcome of this analysis is students realize that regardless of how a factor may (or may not) affects speed of the wave, the product of wavelength and frequency is always equal to the wave speed. |
| Cause and Effect: Systems can be designed to cause a desired effect. |
Many cause and effect relationships surface as students analyze the data presented in this passage. Students should recognize, for example, that changing the medium (either type of rope or tension of a given rope) will require the frequency and wave speed to change for a given standing wave. Passage-end questions address applications of such cause and effect relationships by helping the reader recognize how guitar players use this idea to tune their instrument and to play various frequencies. |
| Analyzing and Interpreting Data: Apply concepts of statistics and probability (including determining function fits to data, slope, intercept, and correlation coefficient for linear fits) to scientific and engineering questions and problems, using digital tools when feasible. |
Experimental results often require scientists to determine whether small fluctuations in data are significant or merely the result of error in measurement. This passage provides the student with such experimental results. Students must apply basic principles of statistics and probability to discern whether vibrating a rope at a higher frequency has any effect on wave speed. As they do, students learn from Experiment 1 about the inverse relationship between wavelength and frequency. |
| Using Mathematical and Computational Thinking: Use mathematical representations of phenomena to describe explanations. |
In this quantitatively rich passage students encounter may direct and inverse relationships between the quantities measured. They also discover that for all trials in each experiment, wave speed is the product of wavelength and frequency. Applying this relationship, students are asked to predict the shape of a wavelength versus frequency graph. In addition, students are asked to use such quantitative relationships to extrapolate as they determine values beyond the range of collected data. |
| Planning and Carrying Out Investigations: Plan an investigation or test a design individually and collaboratively to produce data to serve as the basis for evidence in building/revising models, supporting explanations for phenomena, or testing solutions to problems. Consider possible confounding variables and ensure variables are controlled. |
After students investigate the results of three standing wave experiments, several end-of-passage questions require them to analyze why the experiment was designed in the way that it was. Students are asked to infer the purpose the experiments and to use the context of the experimental descriptions and data tables to identify independent variables and controls. |
Associated Reading from The Physics Classroom
Other Supporting Pages at The Physics Classroom:
View Infographic.
(Coming Soon)
Search the NGSS Corner
Maybe you're looking for something really specific that pertains to a desired topic and emphasizes one or more of the listed NGSS dimensions. Why not try a search of this section of our website? Simply select from one or more of the pull-down menus and click Search This page will reload and a collection of possibilities will be displayed in this section of the page and sorted by relevancy.