 Stopping Distance
Resource:
The Science Reasoning Center: Stopping Distance
Grade Level: High School
Description:
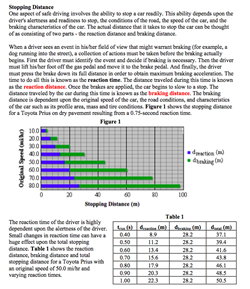
This passage presents data regarding the relationship between reaction time, car speed, reaction distance, braking distance, and total stopping distance. The data is presented in the form of a bar chart and a data table. Questions target a student's ability to recognize and use numerical patterns, to select relevant data from a graph or table, to combine information from two or more data presentations to answer questions, and to interpolate and extrapolate using the provided data.
This activity aligns with the three dimensions of the Next Generation Science Standards in the manner described below:
| Cause and Effect: Cause and effect relationships can be suggested and predicted for complex natural and human designed systems by examining what is known about smaller scale mechanisms within the system. |
In the stopping distance passage presented here, students are asked to explore at least two cause and effect relationships. Question 1 at the end of the passage, for example, “How does an increase in speed affect the reaction distance and braking distance?” illustrates this cause and effect relationship. As this passage points out, such a cause and effect relationship is so very important for automobile drivers to understand. |
| Analyzing and Interpreting Data: Analyze data using tools, technologies, and/or models (e.g., computational, mathematical) in order to make valid and reliable scientific claims or determine an optimal design solution. |
Questions 1, 3, 5, 9 and 10 at the end of the passage require students to analyze data presented in both a stopping distance graph and data table. Analysis of the graph helps the reader understand how speed affects stopping distance; analysis of the data table presented provides an opportunity for the student to see the impact of slower reaction times on stopping distance. |
| Engaging in Argument from Evidence: Make and defend a claim based on evidence about the natural world that reflects scientific knowledge, and student-generated evidence. |
Students are asked to make claims about a car’s stopping distance in new situations as they apply the given data to these different scenarios. Students are then asked to support such claims with evidence from the passage. |
| Using Mathematical and Computational Thinking: Use mathematical representations of phenomena to describe explanations. |
Several questions presented at the end of this passage ask students to determine the effect of doubling one quantity (such as speed or reaction time) on another (such as stopping distance). Questions 2, 6, 7 and 8 are example how students are asked to use such mathematical and computation thinking to solve these types of problems and then provide explanations to explain their reasoning. |
Associated Reading from The Physics Classroom
Other Supporting Pages at The Physics Classroom:
View Infographic.
(Coming Soon)
Search the NGSS Corner
Maybe you're looking for something really specific that pertains to a desired topic and emphasizes one or more of the listed NGSS dimensions. Why not try a search of this section of our website? Simply select from one or more of the pull-down menus and click Search This page will reload and a collection of possibilities will be displayed in this section of the page and sorted by relevancy.